Government Funding
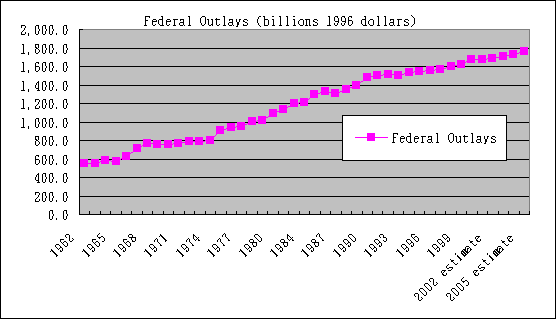
The first two graphs show total Federal government
spending and NASA spending in billions of dollars. These dollars
are 1996 constant dollars which means they been adjusted
for inflation based on the value of the dollar in 1996. While
government spending steadily continues to increase,
NASA spending continues to decrease or remain the same.
For reference from 1962 through 1969, NASA spent
$154 billion, and the often quoted cost of going to the Moon is
about $80 billion.
|

|
While goverment spending continues to grow, NASA's budget continues shrink. Even in the properous 1990s, Clinton, Gore, and Congress have decreased NASA's resources. |

|
The reason for the steady increase in government spending is the fact that the economy continues to grow. With the advancement of technology and productivity, we can produce more and more every year. However, if NASA only gets the same amount of money every year while the economy and government spending continues to grow every year, then the fraction that the US government spends on space must be shrinking every year. The graph below clearly show that NASA spending is only 1/7 (14%) of its peak as a percentage of the federal budget and is now less than 1% of federal spending. |

|
Most people want to go to Mars, but many think it will cost too much. The purpose of this explanation is to show how little it will cost in the big picture. The total cost of a human Mars mission is $25-55 billion dollars over a ten year period. First, this is much less than the $80 billion we spent going to the Moon. At $3-6 billion per year, that is a 25%-50% increase in NASA's budget assuming no cuts in current programs. However, that number is only 1%-2% of the US's defense budget or only .2%-.4% of the total federal budget. For less than a half a penny of every dollar you pay in taxes, we can put human beings on Mars. |
|
That's only .04%-.08% of Gross Domestic Product (GDP) or about 1/10 the relative cost to society as the Apollo project! MS Excel spreadsheet from which these graphs were generated. All numbers are from Office of Budget and Management's U.S. Budget. Next: What are our Michigan
Representatives doing? |